📺 Watch this and other posts on YouTube or listen on Spotify, Apple Podcasts, and YouTube Music.
Intro
We’ll help you understand the odds of needing long-term care like Alan from The Hangover understood the odds of blackjack.
The only difference is that while he might have walked away from the table with a pile of chips, you’ll come away with something more practical. You’ll understand why averages don’t always tell the full story and what 70% really means for your long-term care planning.
If you haven't seen the movie, enjoy this 30-second clip.
Use the same acronym we use for long-term care (LTC) as a reminder to Learn about options, Talk with family, and Create a plan. The stats in this post lay a strong foundation to help you with all three.
Post jargon
Alzheimer's: the most common type of dementia (memory impairment or loss)
distribution: how data is spread out
home care: LTC provided at home
LTC: long-term care
LTCi: long-term care insurance
➡️ Explore all the LTC jargon
Warning: Boring ahead 🚨
If you don't like numbers or stats, this post might get super boring. If you get bored, we recommend you think about cute little kittens.

There's a 52.3% chance they'll bop noses.
Problems with averages
Before we discuss averages, let's understand why averages can be misleading.
Two people walk into a bar. One's financial net worth is $2 billion. The other's is $0. On average, their net worth is $1 billion!

There is a common saying in statistics: “If your head is in the oven and your feet are in the freezer, on average, you feel just fine.”
Averages are more relevant to populations than to individuals. Although the odds of me having blue eyes are low (9%), I have blue eyes. I'm 100% sure. Ultimately, only your result matters to you.

Averages are not bad. They're a useful starting point to help you make decisions, but personal situations matter most. Consider your unique family history, finances, and other factors as you decide on a long-term care plan.
Odds of aging
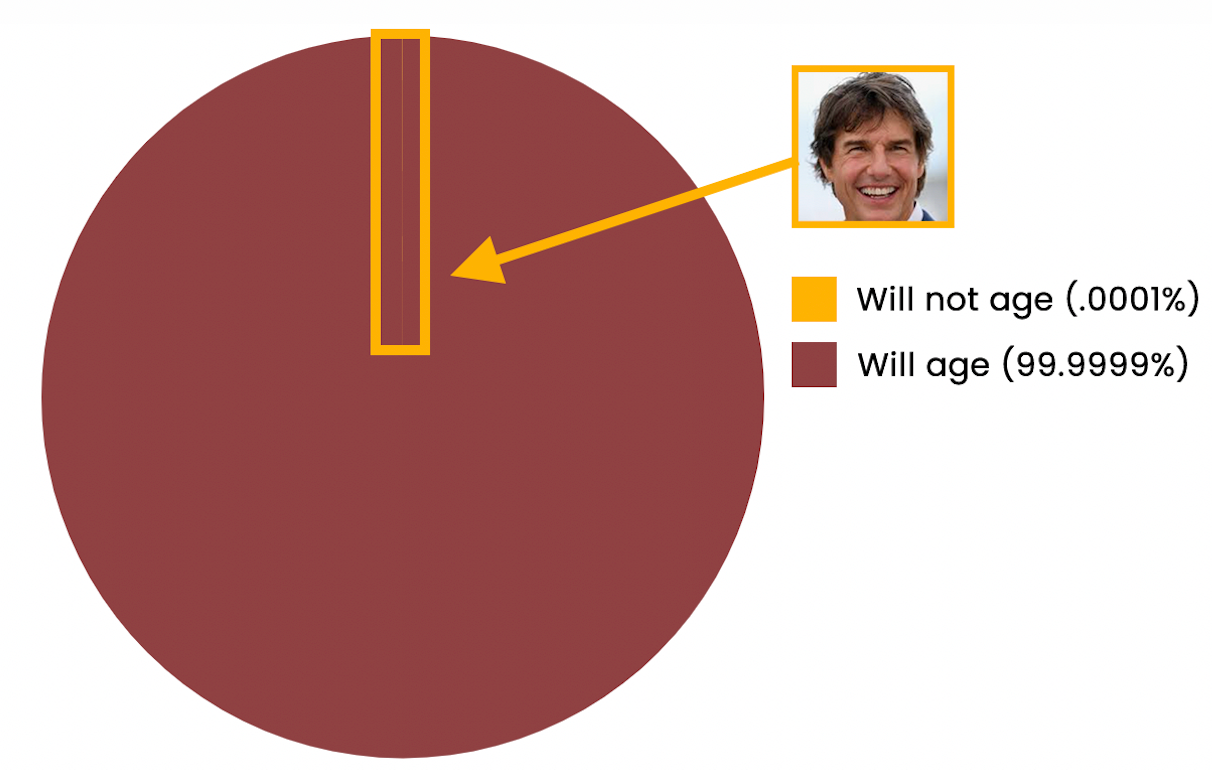
Your odds of aging are 99.9999%. To date, the only exception is Tom Cruise.

Why this matters
(Almost) Everyone ages, and with aging comes the real possibility of needing long-term care.
Lifetime risk (65+)
The lifetime risk for a 65+ adult receiving long-term care is a whopping 70%.
If you have a partner, the odds that one of you will need LTC jumps to 91%. If your parents are still living, you may be asked to take on the role of their caregiver.
Why this matters
- The reality is that you or someone close to you will need long-term care. You just don't know when and for how long. That’s why creating a plan is so important.
- To put 70% in perspective—that's roughly the same percentage of adults in the U.S. who are parents. A lot of people will need LTC.

Under 65 risk
While LTC is more common among older adults, 37% of those receiving long-term care were under 65, often because of chronic conditions, injuries, or disabilities.
Why this matters
You can't purchase LTCi if you already need care, so consider purchasing insurance early to avoid a decline, get better coverage, and save money.
Unpaid vs. paid LTC
The choice between paid and unpaid long-term care varies on the care setting.
Why this matters
- Long-term care is expensive. Unfortunately, Medicare and private insurance don't cover LTC costs, and MedicAID only assists those with severe financial hardship or a disability.
- High costs often lead to family members providing unpaid care, which often leads to significant financial costs and personal challenges. Plan ahead to prevent caregiver creep (e.g., occasional car rides that turn into assistance with bathing).
Cute kitten break

Length of care
The average length of long-term care is approximately 3 years, but this average doesn't tell the entire story. Gender is a big factor.
Why? Because women live longer.

The chart below shows how long older adults need care. For example, 28% of older adults need 0-2 years of care.
But the distribution is funky. Notice the uptick in care at 10+ years.
Why this matters
- While the average length of long-term care is about 3 years, individuals with Alzheimer’s often require 8–10 years of memory care, with some needing care for up to 20 years.
Length of care by type
In other posts, we'll go into more detail about home care, assisted living, nursing homes, memory care, and hospice—but here's a quick look at how long people typically need care in each setting.
Why this matters
- When budgeting for long-term care, consider both the length of care needed for each type of facility and the costs associated with each option.
Other important stats
- The current life expectancy is 80 for females and 75 for males and projected to increase by 4 years by 2050.
- You're more likely to need LTC if you survive to older ages. So, if you eat well, exercise, and live longer, you have a higher chance of needing LTC (but hopefully less intensive needs).

Wrap up
A really high percentage of people will need long-term care. Some will need just a little, while others will need quite a lot.
Use this data to guide your planning, but remember: the real win, like Alan's blackjack victory, comes from making decisions that fit your personal circumstances.


